Description
|
Large datasets of particle data like the ones generated in SFB 716 still pose a big challenge for visual analyzing methods. Explorative analysis is important when unexpected effects inside the data occur. For this kind of analysis, interactive visualization provides an optimal method and therefore plays a key role inside the SFB.
Subproject D.3 faces the challenge of visualizing large, time-dependent particle datasets. New methods and algorithms are developed to reach this goal. Major enhancements to particle visualization are needed as well as close cooperation with domain experts inside the SFB to accomplish this task.
To this end, an extensible and adoptable visualization framework has been developed during the first funding period: MegaMol™. renderers and data structures form the basis for the current visualization research for this subproject, as well as for the visualization subprojects D.4 and D.5.
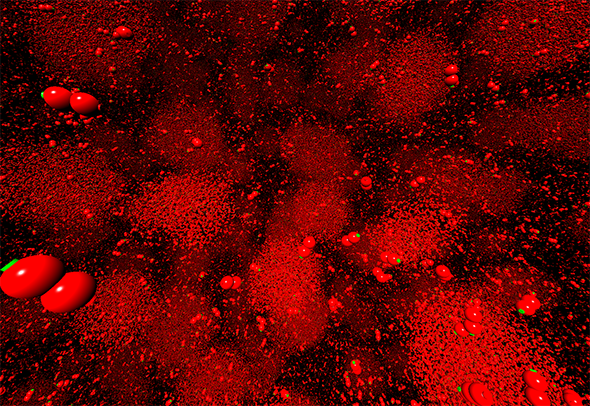
Particle-based visualization has been developed further massively in SFB subprojects. The point-based visualization approach as well as GPU-raycasting of implicit surfaces makes is possible to interactively visualize datasets containing millions of particles at high quality. Extensive optimizations to these methods have been accomplished in cooperation with subprojects A.1 (Fig. 1), B.1 and B.5.
Due to the increasing complexity of data and due to the variety of available visual metaphors, it is important to interactively parameterize the visualization techniques and to filter the input in such a way that regions of interest are easy to explore and application-specific phenomena can be efficiently analyzed.
To cope with the growing dataset sizes, we want to extend available methods for compression of raw data such that relevant visual and application-specific physical properties are preserved and such that these properties can be analyzed in a visualization after data reconstruction.
We strive to enable long-term archiving and offline-analysis of large-scale simulation runs.
At the same time, we want to make such simulations runs available for visualization on many different devices, such as tablets, workstations, display walls, using such reduced data representations.


