
Results
Protein representations
|
|
|
|
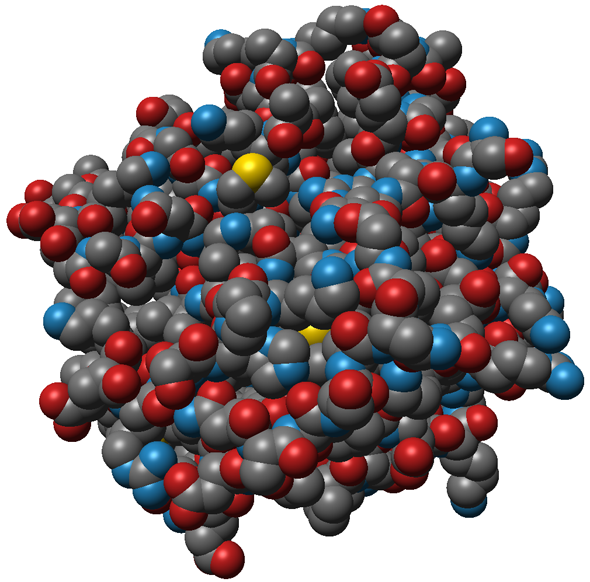
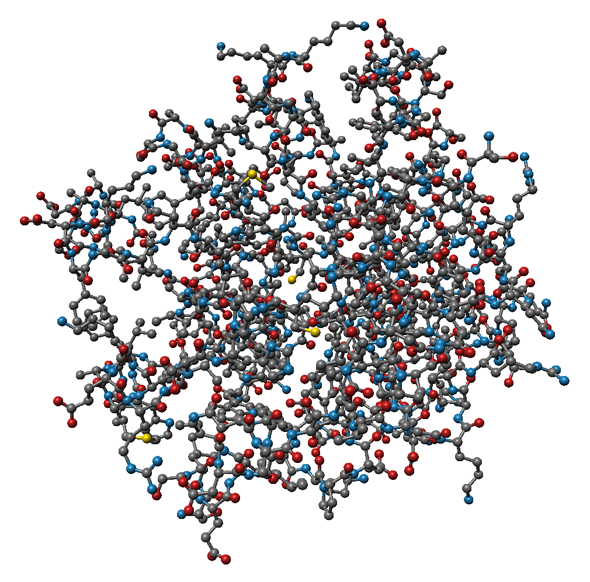
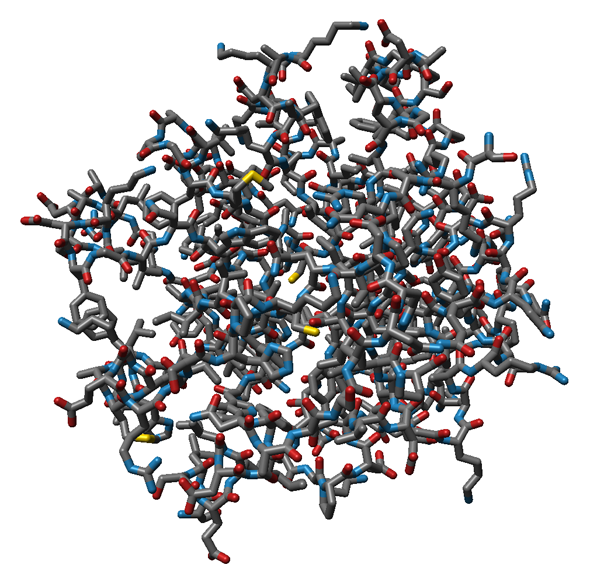
Interactive visulization of proteins and other (bio-)molecules is an important tool for visual analysis of time-dependend molecular dynamics (MD) simulation results. These so-called trajectories contain ten to one-hundred thousand time steps of an MD simulation and often consist of more than 20GB of data. Commonly used protein representations were implemented using state-of-the-art visualization methods, while expoiting the possibilities of modern hardware for fast computation speed. The currently supported atom-based molecular representations (see Fig. 1) are rendered using GPU raycasting of point-based glyphs, which fascilitates interactive frame rates.
|
|

The secondary structure of a protein is shown in abstract visualizations like the cartoon or ribbon representation (see Fig. 2). This representation is based on the folding of amino acid chaines into the secondary structure elements helix, sheet, turn, and random coil. The implementation developed in this project creates the necessary geometric information in a geometry shader on the GPU, which results in a high framerate, even for large trajectories. More details can be found in "GPU-based Visualisation of Protein Secondary Structure".
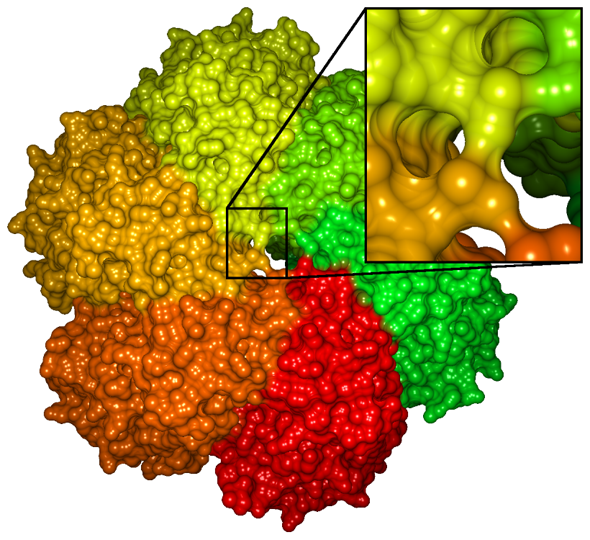
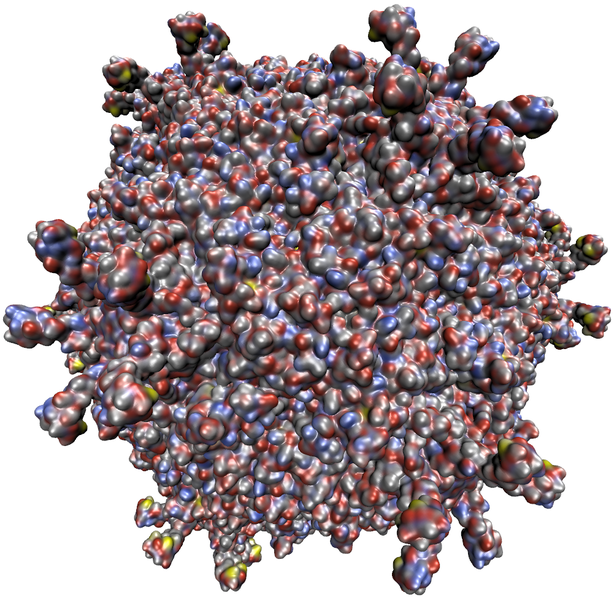
Molecular surface representations are necessary to analyse the interface between the protein and the surrounding medium (solvent) or other molecules. Typical applications are the investigation of docking processes (the protein's interaction with other molecules) or the analysisd of specific surface characteristics (e.g. binding sites or hydrophobic/hydrophile regions) or inner structures like cavities. The Solvent Excluded Surface (SES) is the most common representation of the molecular surface, since it supports all of the aforementioned application scenarios (see Figure 3).
|
|
|
|
Due to costly pre-computations, the visualization of the SES with interactive frame rates is a challenging task. Within the context of SFB, an implementation was developed which allows for section-wise updates of the surface representation using GPU point-based glyphes. Furthermore, a semantic reduction of the atom data was suggested, which facilitates higher frame rates during the rendering. A more detailed explanation of the used methods can be found in "Interactive Visualization of Molecular Surface Dynamics", "Parallel Computation and Interactive Visualization of Time-varying Solvent Excluded Surfaces" and "Parallel Contour-Buildup Algorithm for the Molecular Surface" .
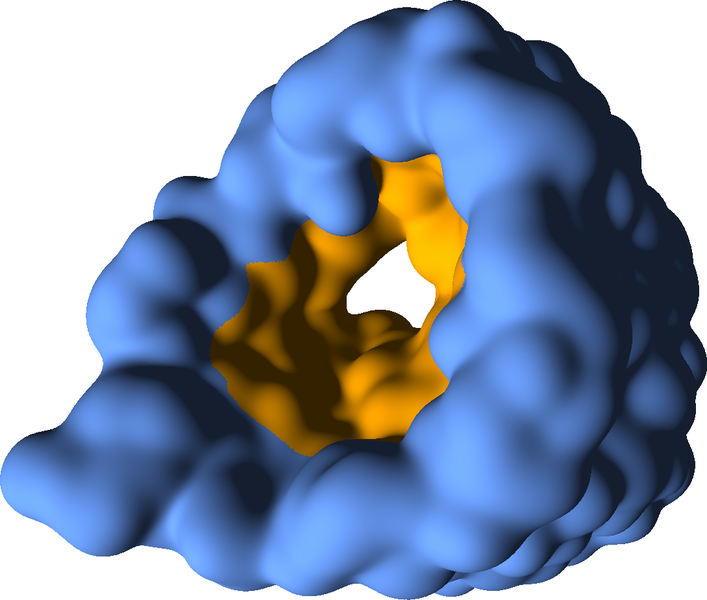
The aforementioned method allows to compute and visualize the SES for molecules with up to 10,000 atoms while maintaining interactive frame rates. For larger data sets, an adequate approximation to the SES was developed with researchers of the University of Illinois at Urbana-Champaign This approximation (see Figure 4) is computed entirely on the GPU. Using this representation, it is possible to render the surface of molecules with more than a million atoms while maintining interactive frame rates. For more details see "Fast Visualization of Gaussian Density Surfaces for Molecular Dynamics and Particle System Trajectories").
Visualization of Solvent
|
|
|


Solvents can substantially influence the functionality of a protein. It is, therefore, crucial to analyse the characteristics of the solvent. Computing and visualizing solvent molecules' paths allows investigating both regions of consensed water and the solvent molecules' principle paths through binding pockets. More detailsabout this application can be found in "Visual Abstractions of Solvent Pathlines near Protein Cavities" beschrieben.
Filters are an important tool for the visualization and analysis of the solvent, since they allow e.g. omiting solvent molecules that are not interacting with a protein or another polymer (see "Interactive Exploration of Polymer-Solvent Interactions"). Furthermore, temporal aggregation of the solvent molecules or the ions in the solvent allows to analyse their mean movement direction and velocity (see "Visual Analysis for Space-Time Aggregation of Biomolecular Simulations").
Analysis and visualization of cavities
|
|
|
|
|
|
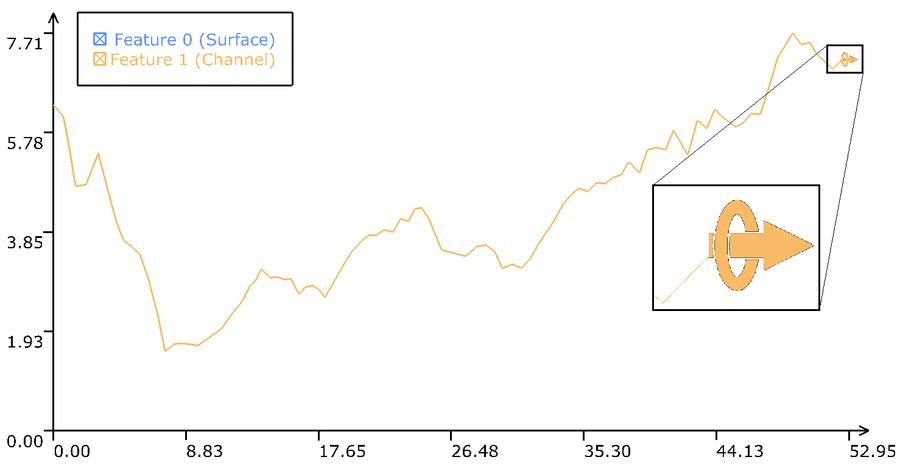
A protein's structure plays an important role for its functionality. Essential is not only the aforementioned secondary structure, but also the spatial structure of the molecular surface, since the surface is the molecules' interface to the surrounding molecules. Within several subsequent publications, holes inside proteins were investigated, aswell as cavities and finaly the accessibility of binding sites and channels. Here, the cavities were tracked over time to analyse changes during the simulation. The necessary computations are GPU accelerated and are executed in real time during the visualization, hence, not pre-computations are necessary. Additionally, the analysis is supported using diagrams and graphs, which represent the stationary and the extracted dynamic properties of the simulated molecules. Methods and applications are described in "Interactive Exploration of Protein Cavities", "Interactive Extraction and Tracking of Biomolecular Surfaces Features" and "Visual Analysis of Dynamic Protein Cavities and Binding Sites".
Visual Analytics of protein ensembles
|
|
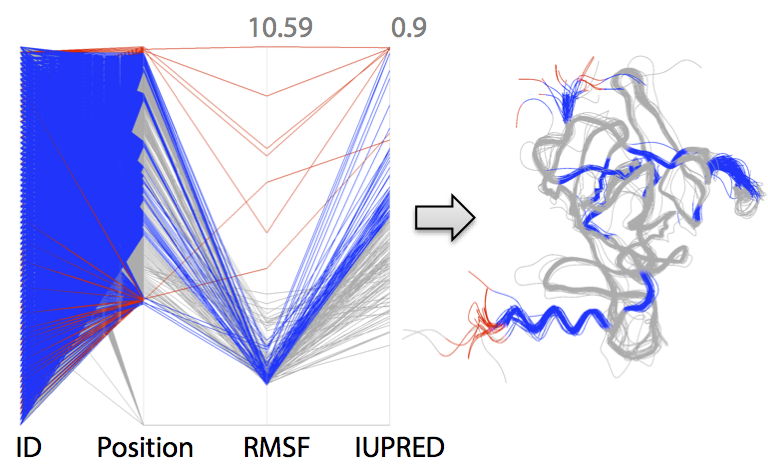
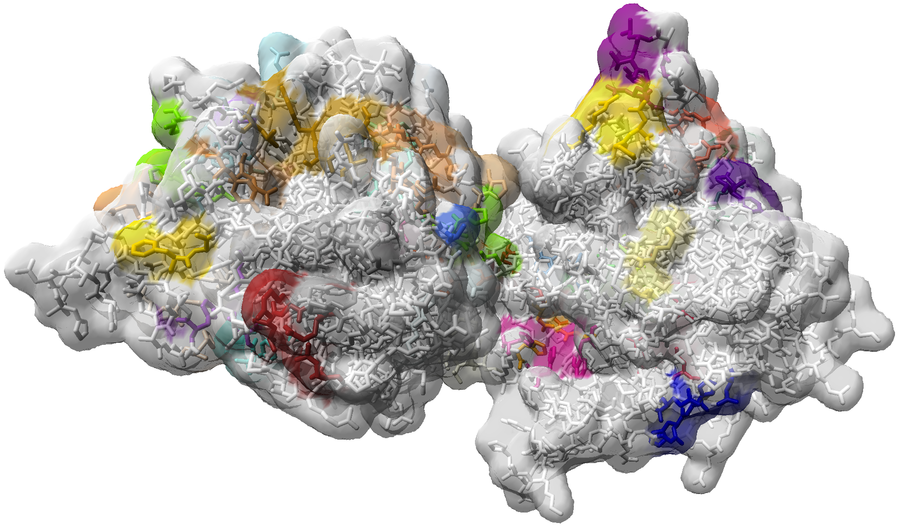
In cooperation with project D.5 and researchers of the CSIRO in australia, a visual analystics application was implemented for the investigation of protein ensembles. Ensembles of comparable proteins can be gathered from data bases or stem from different MD simulation results. The application aims at providing the user lots of additional information concerning the individual proteins of the ensemble, which are extracted using different analysis approaches. Using a representation in parallel coordinates, the user is enabled to find correlating and anticorrelating attributes and to omit uninteresting parameter domains. Simultaneously, the result is visualized in a super-imposed 3d rendering of the protein ensemble (see Fig. 11). Further details can be found in "Visualising Intrinsic Disorder and Conformational Variation in Protein Ensembles". An executable test version (Windows) can be downloaded here.
MegaMol demonstrator
All visualizations within subproject D.4 are implemented as MegaMol plugin. MegaMol is a visualization frame work that is developed within subproject D.3. More information and a pre-configurated demo version for several protein visualizations can be found on the MegaMol home page: www.visus.uni-stuttgart.de/megamol/wiki/Protein.
Map-based visualization of protein surfaces
Analyzing depictions of molecular surfaces one serious flaw of exisiting visualizations (cf. Fig. 3, 4) is recognizable. The intertwined structures of the surface as well as the three-dimensionality hinder an instant perception of the whole surface at once. Therefore, a method for the generation of two-dimensional surface representations was implemented. First, the protein surface is deformed into a sphere.
 |
|
This sphere is then used to generate a map of the surface, using map projection methods known from cartography, like the Mercator-projection, for example. For more details, please be referred to "Molecular Surface Maps".
 |
|
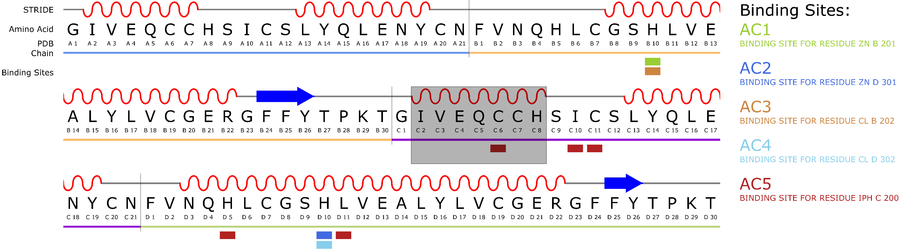
Uncertainty visualization for protein secondary structures
The cartoon representation (See Fig. 2) is a popular visualization method for proteins, as it encodes the secondary structure as well as its spatial conformation. Typically, one additional value can be represented using color. If now a second value, like uncertainty, has to be shown, existing visualizations are not sufficient
We developed an approach to encode additional variables into the known cartoon represention by modifying the waviness of the surface. Based on the magnitude of the represented value, the frequency of the deformation as well as the height is modified.
The resulting visualization then allows for an easy comparison of the added values. "Uncertainty Visualization for Secondary Structures of Proteins" further details the presented approach.